
What to measure, what to ignore, and how to make AI visibility mean something in a revenue conversation.
Your marketing dashboard is measuring the wrong things. Organic sessions, keyword rankings, and click-through rates — these metrics were built for a world where buyers discovered you by clicking a blue link. That world still exists, but it now shares the stage with something fundamentally different: AI assistants that synthesize answers directly, cite sources selectively, and shape purchase decisions before a buyer ever visits your site.
When a procurement lead asks ChatGPT which platforms dominate a category, or a CTO queries Perplexity for shortlisted vendors in a solution space, that visibility event generates no impression in Google Search Console, no session in GA4, no rank in your SEO tool. Your brand is either in the answer or it is not — and your current reporting infrastructure almost certainly cannot tell you which.
Generative Engine Optimization (GEO) is the discipline of ensuring your brand appears credibly and consistently in AI-generated responses for your highest-value topics. Measuring it requires a different set of metrics — one that connects AI visibility to pipeline outcomes, not just traffic. This article defines that metric set, explains how to link it to revenue, and gives you a concrete executive dashboard you can review monthly with RevOps and the CEO.
Why Traditional Search Metrics Are No Longer Sufficient
Traditional SEO measurement assumes a linear path: a user queries a search engine, your content earns a position, they click, and they arrive. Every step generates data — impressions, CTR, sessions, and time on page. The model works because Google surfaces links, and clicking links leaves a trail.
Generative engines break this assumption at the first step. When a user prompts an AI assistant, the engine synthesizes an answer from multiple sources and presents it as its own response. The user rarely clicks anything. Your content may have informed the answer, or it may have been ignored entirely — and neither outcome registers in standard analytics.
The practical consequence is a blind spot in your demand funnel. Buyers using AI for vendor research are conducting high-intent evaluation activity with no detectable footprint in your data. If your brand is absent from AI answers on your core commercial topics, you are losing consideration at the top of the funnel with no warning signal from your current metrics.
Two additional compounding factors are worth naming explicitly. First, AI inclusion is not random — it reflects how credibly your content is perceived across the web, how frequently authoritative third parties reference your brand, and how well your content aligns with the semantic frameworks AI models use to evaluate expertise. Absence from AI answers is therefore diagnostic: it tells you something meaningful about your authority footprint. Second, the platforms driving this shift are growing rapidly. Gartner projected a 25% decline in traditional search engine volume by 2026 as AI assistants absorb more discovery queries. The measurement gap will widen if you don't address it now.
A note on data quality: GEO metrics, particularly AI-driven visit share, are partially modeled rather than directly measured. The tooling is maturing but imperfect. The right response to this is not to wait for cleaner data — it is to build a measurement framework now, establish baselines, and refine methodology over time. An imperfect signal acted on is more valuable than a perfect signal that doesn't yet exist.
See also: SEO vs GEO for B2B: How AI Is Changing Search Strategy
|
Do you know how AI is positioning your brand? Want to know your current AI Share of Voice? We'll measure it for you — free.
|

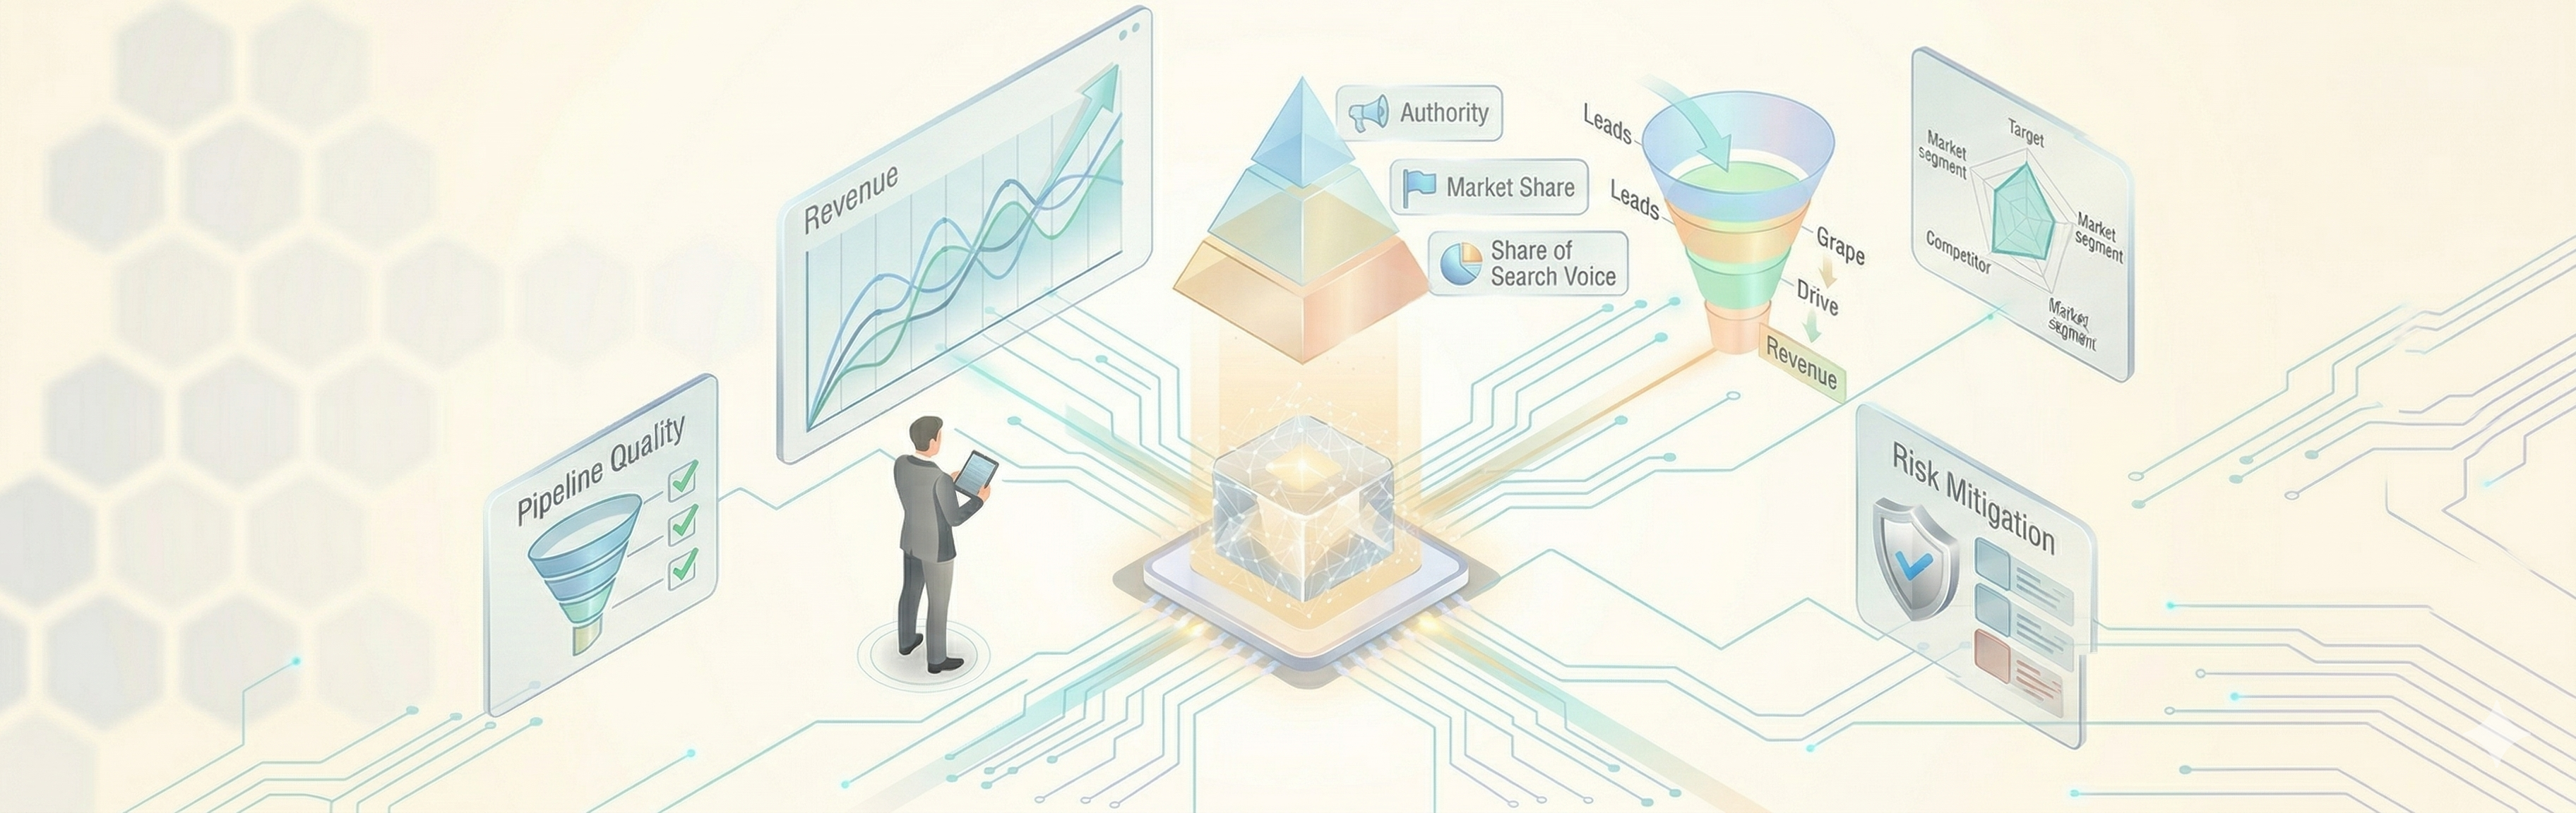
The Four Core GEO Metrics Executives Need to Track

1. Share of Summary (Answer Share of Voice)
Answer Share of Voice (ASoV) is your percentage of inclusion in AI-generated responses across a defined set of prompts representing your priority topics. Think of it as market share of answers, not positions.
The formula is straightforward: ASoV = (Number of prompts in which your brand appears) ÷ (Total prompts tested) × 100, calculated per engine, per prompt category, per reporting period.
To operationalize this metric, you need a prompt matrix — a structured set of queries organized by buyer persona, funnel stage (problem awareness, solution exploration, vendor comparison), and your top commercial topic clusters. A mature prompt matrix for a mid-size B2B company typically covers 30 to 60 prompts, tested monthly across ChatGPT, Perplexity, Google AI Overviews, and Gemini.
The right mental model is the shortlist inclusion rate. In most AI answers covering vendor or product categories, only three to five brands are named. ASoV measures whether you are consistently on that shortlist for the prompts that map to your buyers' actual research behavior. A high ASoV on low-value prompts is a vanity metric. A low ASoV on your top five commercial topics is a pipeline risk.
2. Share of Citation
Share of Citation is distinct from ASoV and often confused with it. ASoV measures whether your brand is mentioned in an AI answer. Share of Citation measures whether your owned or earned content is being pulled as the evidential basis for that answer — whether you are linked or referenced as a source.
Both matter, but they tell different stories. A brand mention without citation means the AI has absorbed your brand name into its training data as a recognized entity. A direct citation means the AI is actively retrieving and surfacing your content as authoritative evidence. The latter is harder to earn, more durable, and more directly actionable from a content strategy perspective.
Track citation share in two ways: linked citations (where an AI platform like Perplexity or Google AI Overviews includes a hyperlink to your content) and unlinked citations (where your content or data is referenced without attribution). Linked citations can be measured directly in GA4, with referral traffic segmented by LLM source. Unlinked citations require prompt monitoring tools that capture the full text of AI responses for analysis.
Share of Citation also illuminates your third-party authority footprint — the review sites, analyst reports, industry publications, and community platforms that AI engines treat as credible intermediaries. If your citation share is low despite high brand recognition, the problem is rarely your owned content alone; it is typically the absence of corroboration from authoritative external sources.
3. Frequency of Inclusion by Priority Topic
Not all prompts carry equal commercial weight. Frequency of inclusion by priority topic applies a filter of business relevance to your broader ASoV data by mapping AI inclusion rates specifically against your highest-value commercial topics — the problems, categories, and use cases that represent your actual buying journey.
This is where GEO measurement intersects most directly with demand generation. If you are consistently excluded from AI answers on the ten prompts that represent your core buying journey — the questions your target buyers demonstrably ask during evaluation — that is not an SEO gap. It is a pipeline risk that belongs in a revenue discussion.
Operationalizing this metric requires disciplined prompt prioritization. Work with sales and RevOps to identify the questions that appear most frequently in early-stage buyer conversations. Map those questions to AI prompts. Test them monthly. Track inclusion frequency per topic cluster as a standalone metric rather than averaging it into a general ASoV figure, which can mask underperformance on your most commercially critical topics.
4. AI-Driven Visit Share (Modeled)
This is the most contested GEO metric — because it cannot be directly measured in most analytics environments and requires a degree of inference. That is not a reason to avoid it. Every meaningful marketing attribution model involves modeling assumptions; AI-driven visit share is no different.
The metric has three components you can instrument today:
| Signal | What it measures | Where to find it | Limitation |
| Direct LLM Referral Traffic |
Visits that originate from AI platforms |
GA4 — source/medium segmentation (chatgpt.com, perplexity.ai, gemini.google.com etc.) |
Only captures users who clicked through — zero-click interactions are invisible |
| Branded Search Lift |
Indirect AI-driven discovery via subsequent brand searches |
Google Search Console — branded query volume trends |
Correlation only; other factors can drive branded search spikes |
|
Form-Field Attribution |
Self-reported first touch from AI assistants |
Conversion forms — "How did you first hear about us?" |
Relies on user recall and honesty; undercounts passive AI influence |
Combine these three signals into a modeled AI-driven visit share figure, document your methodology, and track it as a trend rather than an absolute. The goal is directional accuracy over time, not decimal precision in month one.
See also: The CMO’s Guide to Generative Engine Optimization (GEO) in B2B
Connecting GEO Performance to Revenue Outcomes
Share of voice metrics earn C-suite attention only when they connect to commercial outcomes. The following three linkages are where GEO performance translates into language the CEO and RevOps will recognize.
GEO Visibility and Opportunity Creation
AI-assisted leads — prospects who encountered your brand in an AI answer prior to entering your funnel — often arrive with compressed research cycles. They have already received:
- A sense of your positioning relative to competitors
- A synthesized overview of the category
-
A shortlist of relevant vendors
When they arrive at your site or submit a form, they are frequently further along in their evaluation than their first-touch attribution suggests.
To identify AI-assisted opportunities in your CRM, apply UTM parameters to all LLM referral traffic and create a custom lead source field for AI-origin visits. Layer in form attribution data and first-touch analysis at the account level.
Over time, segment opportunities by whether an AI referral or branded search spike preceded the first CRM touchpoint, and compare average deal size and progression rate against non-AI-assisted opportunities. The differential — if it exists — makes a direct case for GEO investment in pipeline terms.
AI Inclusion and Win Rate Correlation
The hypothesis is straightforward: prospects who encountered your brand in a credible AI answer before engaging with your sales team are more likely to convert, because the AI answer functions as an implicit third-party endorsement from a source the buyer chose to consult.
You did not interrupt them with an ad. They asked a question and received an answer that included you.
Testing this in your own data requires cohort tagging. Identify closed-won and closed-lost opportunities where you can reasonably infer AI exposure, such as:
- LLM referral in the account’s session history
- A branded search spike prior to first contact
-
Self-reported AI attribution
Compare win rates across these cohorts. This analysis is correlational rather than causal, and early sample sizes will be small. Run it anyway — the trend will become clearer with consistent measurement over time.
Sales Cycle Length and AI-Primed Buyers
Buyers who arrive having already consumed AI-generated category education skip steps in the sales cycle. They know the competitive landscape, understand the solution category, and often have a pre-formed view on shortlisted vendors.
Deals tied to AI-referred traffic or inferred AI touchpoints frequently show faster progression from first meeting to proposal — not because of anything your sales team did differently, but because the buyer’s education happened earlier.
The highest-leverage area to track here is evaluation-stage prompts, such as:
- “[your brand] vs [competitor]”
- “best [category] for [use case]”
-
“[category] alternatives”
Measure impact by tagging opportunities where this visibility is confirmed and tracking average time from first meeting to proposal against your baseline.
See also: Budget Allocation with AI Insights for Revenue-Focused CMOs
|
Where are you losing deals before they reach you? Find out which AI answers are shaping your buyers' shortlists — and whether you're on them.
|
The Executive GEO Dashboard: 5–7 KPIs, Monthly Cadence
The following dashboard is designed for a monthly review between marketing leadership, RevOps, and the CEO. Review it monthly, in the same meeting where you review pipeline. The audience is marketing leadership, RevOps, and the CEO. Keep the presentation to trend lines across three to six months — a single month's numbers are statistically meaningless in a measurement environment this new.
Answer Share of Voice (ASoV)
Your lead metric. It tells you what percentage of your priority prompts — the questions your buyers are actually asking AI assistants — return an answer that includes your brand. This is the closest GEO equivalent to market share, and it is the number your CEO will understand fastest. Own it in Marketing, report it by engine, and set targets by topic cluster rather than as a single blended figure.
Citation Rate
ASoV tells you whether you appear. Citation Rate tells you whether you matter. A brand mention means the AI knows you exist. A citation means the AI is using your content as evidence. The gap between the two numbers is your content authority gap — and closing it requires a different set of actions than simply producing more owned content. Track linked and unlinked citations separately. The former shows up in GA4; the latter requires monitoring tools.
Priority Topic Inclusion Score
ASoV with commercial intent applied. Strip out the prompts where your inclusion doesn't translate to buying behavior and score your presence exclusively across the ten to fifteen topics that map to active purchase decisions. This is the number that belongs in a pipeline review, because a sustained drop here has a direct forecast implication.
AI-Driven Visit Share
A modeled metric and should be presented as one. Combine direct LLM referral traffic from GA4, branded search volume trends from Search Console, and self-reported attribution from your conversion forms into a single estimated figure. Document the methodology once, apply it consistently, and track the trend. The number will be imprecise. The trend will be real.
AI-Assisted Opportunity Count
This is where GEO connects directly to revenue. These are CRM-tagged opportunities where an AI referral, a branded search spike, or self-reported AI attribution appears somewhere in the account's pre-CRM history. This is RevOps' metric to own, and it is the one that ends the conversation about whether GEO investment is justified.
Answer Sentiment Score
Tracks how AI characterizes your brand when it does include you — whether the framing is positive, neutral, or negative across your monitored prompt set. This matters because inclusion without favorable characterization can actively damage consideration. A competitor described as the enterprise standard while you are described as a budget alternative is winning the AI answer even if you both appear in it.
Competitive Displacement Rate
Optional, and only meaningful once you have six or more months of baseline data. It measures how often a direct competitor appears in an AI answer where you don't — which is a more commercially precise version of ASoV because it surfaces not just absence but competitive loss. Add it when the rest of the dashboard is stable and you are ready to run it as an ongoing competitive intelligence function.
See also: Designing a GEO-Ready Content Portfolio for the B2B Buyer Journey
Conclusion
GEO is not a traffic play — it’s a visibility and influence play that happens before a buyer ever enters your funnel. If your brand isn’t showing up in AI answers on your core commercial topics, you’re losing consideration without seeing it in your data.
The fix isn’t more content. It’s better-aligned content and a measurement model that ties AI visibility to pipeline outcomes. Start by defining your prompt set, track inclusion and citation consistently, and connect that visibility to opportunity creation, win rates, and sales velocity.
Key Takeaways
-
Your current analytics infrastructure has a structural blind spot. AI-driven discovery events generate no impressions, sessions, or rankings. If you are only measuring what traditional tools can see, you are missing an entire layer of early-stage buyer activity.
-
GEO metrics only earn executive attention when they connect to pipeline. ASoV and Citation Rate are inputs. AI-Assisted Opportunity Count, win rate correlation, and sales cycle compression are the outputs that justify investment. Report both together or the visibility metrics will always lose the budget conversation.
-
Absence from AI answers is diagnostic, not just competitive. If your brand is consistently excluded from responses on your core commercial topics, it signals an authority and corroboration problem — one that more owned content alone will not fix.
-
Start before the tooling is ready. A manually maintained prompt matrix tested monthly across three AI platforms is sufficient to establish a baseline. Waiting for the right software means waiting for data you should already be collecting.
-
The prompt matrix is the foundation of everything. Every metric in this framework depends on having a well-structured, commercially prioritized set of prompts. Build it with sales, not in a vacuum. The questions that surface most often in early buyer conversations are the prompts that matter most.
|
Not sure where your brand stands in AI-generated answers? Get a free GEO audit and see exactly which metrics you're missing — before your competitors do.
|