

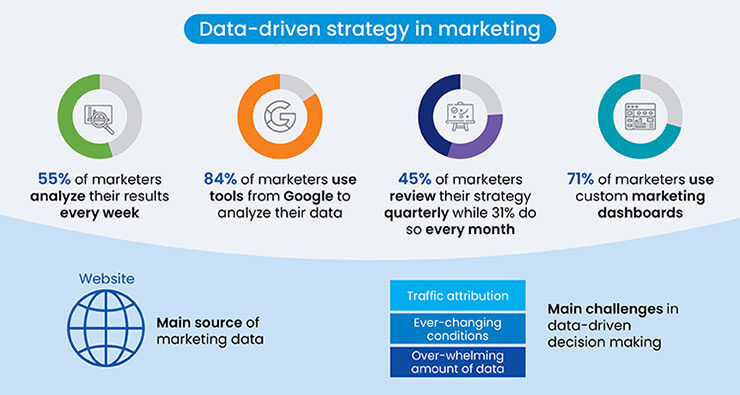
Data-driven decision-making is necessary for B2B marketing, as you need to effectively and efficiently connect with target audiences. B2B marketing analytics (B2BMA) is a game-changer, providing organizations with valuable insights to fine-tune their strategies and achieve better business results.
Marketers need to understand analytics in both business-to-business (B2B) and business-to-consumer (B2C) contexts. B2B analytics looks at longer sales processes, close client connections, and fewer, more intricate deals. On the other hand, B2C analytics deals with larger customer groups, quicker sales, and understanding broad consumer trends across many touchpoints.
Mastering these differences helps B2B marketers use data wisely, improve campaigns, and grow their businesses effectively.
This B2B marketing analytics implementation guide will provide step-by-step instructions for effectively integrating analytics into your marketing strategy, from uncovering valuable audience insights to improving your targeting and optimization techniques.
Understanding B2B Marketing Analytics
B2B marketing analytics collects, analyzes, and interprets data to make informed decisions about B2B marketing strategies and tactics. It encompasses various activities, from tracking campaign performance and customer behavior to identifying growth opportunities and optimizing marketing spend.

By leveraging data-driven insights, B2B organizations can make better-informed decisions, enhance customer experiences, and drive revenue growth.
Benefits of Implementing B2B Marketing Analytics
B2B marketing analytics is the compass that guides businesses through the complexities of modern commerce. It’s not just about keeping up; it’s about setting the pace for success. Here’s why embracing marketing analytics is more crucial than ever:
1. Adapting to change
The B2B marketing environment is rapidly evolving. From digital transformation to the integration of AI, businesses must leverage analytics to understand and adapt to these changes.
2. Improved decision-making and strategy formulation
Analytics provide a data-driven foundation for marketing decisions, enabling organizations to align their strategies with the needs and behaviors of their target audience.
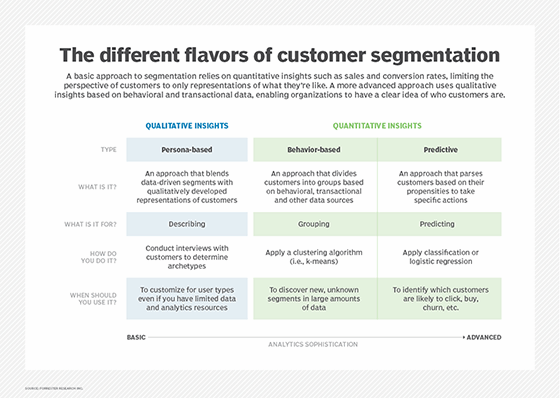
3. Enhanced customer insights and segmentation
By analyzing customer data, B2B marketers can develop a deeper understanding of their audience. This leads to more personalized and effective marketing campaigns and enables businesses to tailor their marketing efforts for maximum impact.
4. Increased ROI and optimized marketing spend
With precise analytics, companies can track the performance of their marketing campaigns. B2B marketing analytics helps organizations identify the most effective marketing channels and tactics, allowing them to allocate resources more efficiently and maximize their return on investment.
Key Components of B2B Marketing Analytics
A comprehensive understanding of the key components of marketing analytics is crucial for driving sustainable growth and making informed, strategic decisions. By embracing a data-driven approach, you can unlock opportunities, optimize your marketing efforts, and position your organization for long-term, sustainable growth.
Data Collection: The Foundation of Actionable Insights
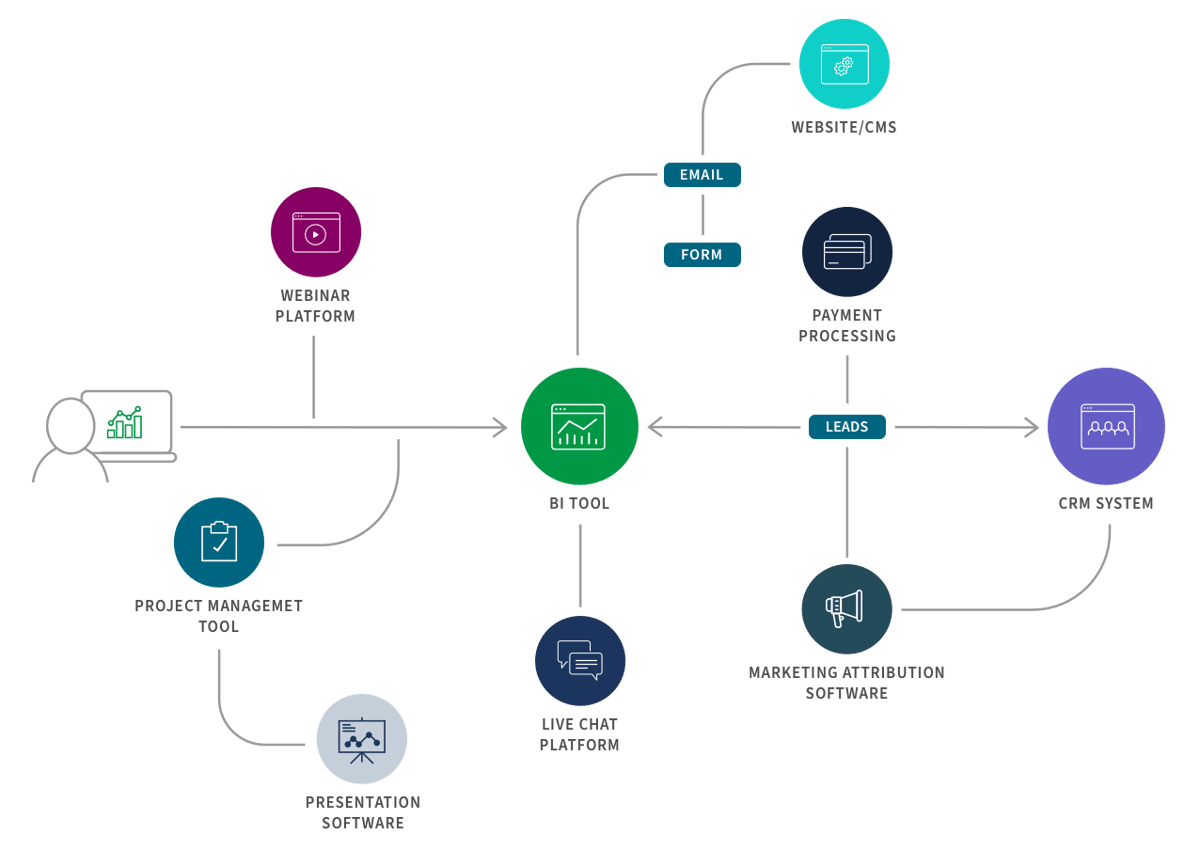
The first step in unlocking the power of B2BMA is to identify and gather the relevant data sources. This may include website analytics, customer relationship management (CRM) systems, social media platforms, and other touchpoints where customers and prospects engage with your brand. They will give you a holistic understanding of your audience's behaviors, preferences, and pain points.
Data Integration: Connecting the Dots for a Comprehensive View
Once you've gathered the necessary data, the next step is to seamlessly integrate it into a centralized repository. This could involve leveraging tools and platforms like data warehouses, customer data platforms (CDPs), or business intelligence (BI) software. You need them to gain a 360-degree view of your marketing performance, customer insights, and overall business health.

Data Analysis: Uncovering Actionable Insights
With your data collected and integrated, it's time to dive into the analysis phase. This is where you'll leverage a variety of techniques and tools to uncover the valuable insights that will drive your B2B marketing strategy. From predictive analytics to customer segmentation, the insights gleaned from your data can inform everything from campaign optimization to personalized content creation.
Reporting and Visualization: Transforming Data into Actionable Intelligence
The final part of the B2B marketing analytics puzzle is presenting your findings clearly, concisely, and visually appealingly. Effective reporting and data visualization is key to ensuring that your insights are easily understood and actioned by decision-makers within your organization. By leveraging cutting-edge tools and platforms, you can transform complex data into compelling dashboards, reports, and presentations that drive strategic decision-making.
Implementing B2B Marketing Analytics: A Step-by-Step Guide
Adopting a comprehensive B2B marketing analytics strategy can be a transformative process for your organization. Here's a step-by-step guide to help you implement B2BMA effectively:
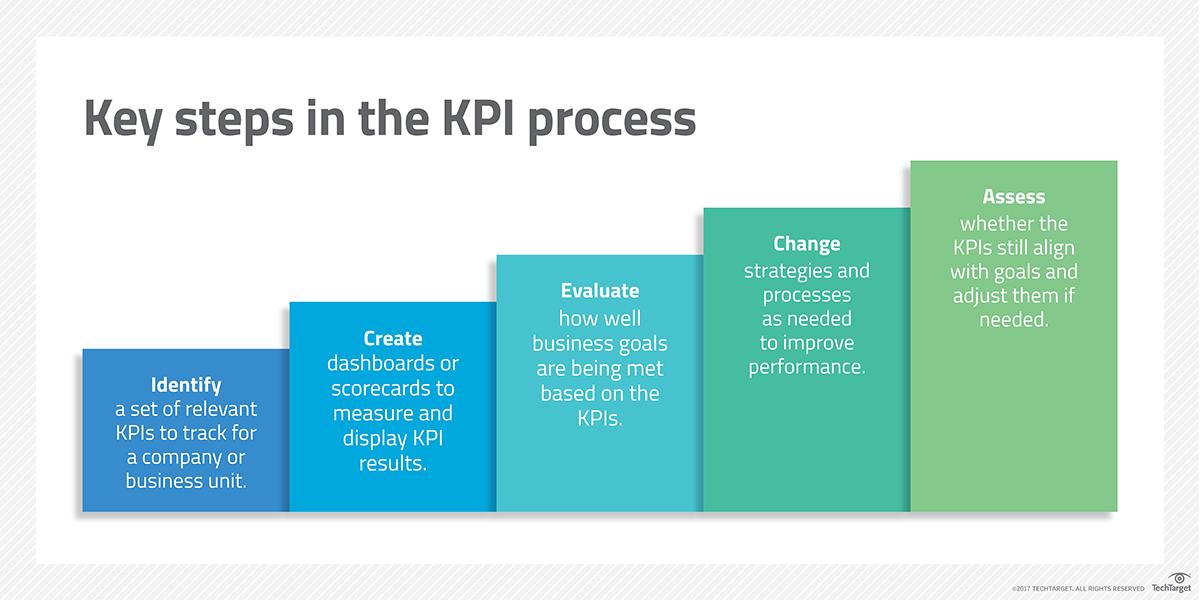
1. Define Objectives and KPIs
The first step in a successful B2B marketing analytics setup is to define clear objectives and key performance indicators (KPIs).
Start by clearly defining your marketing goals and the KPIs that will help you measure success. This could include metrics like lead generation, pipeline velocity, customer acquisition cost, and return on marketing investment. These metrics act as your north star, guiding every decision and ensuring your efforts align with your business goals.
2. Choose the Right Tools
Evaluate the tools available, such as Salesforce B2B Marketing Analytics, Google Analytics, and specialized platforms like Datorama or Domo. Consider factors like data integration, reporting capabilities, and user-friendliness.
Evaluating these tools is crucial based on their features, scalability, and how well they integrate with your existing systems.
3. Integrate Data Sources
Bring together data from multiple sources, such as your CRM, marketing automation platform, web analytics, and social media, to create a comprehensive, data-driven view of your marketing performance.
4. Analyze and Interpret Data
The actual value of data lies in its interpretation. Advanced analytical techniques can uncover patterns and trends that inform strategic decisions, helping you stay ahead of the competition. By analyzing B2B marketing analytics datasets, companies can identify trends and patterns that inform their content creation and distribution strategies.
Leverage advanced analytical techniques, including segmentation, attribution modeling, and predictive analytics, to uncover insights that inform your marketing strategy. Utilize visualization tools to present data in a clear and actionable manner.
5. Create Dashboards and Reports
Effective dashboards and reports are more than just pretty visuals; they’re storytelling tools that communicate complex data in an accessible manner. They should be designed with the end-user in mind, providing actionable insights at a glance.

Develop custom dashboards and reports that align with your specific business objectives. This will help stakeholders understand and act on the insights generated by your B2B marketing analytics efforts.
6. Continuously Monitor and Optimize
The journey doesn’t end with implementation. Continuous monitoring allows you to track performance against your KPIs, while optimization ensures that your strategies evolve with changing market dynamics.
Establish a regular cadence for reviewing your analytics data and adapting your marketing strategies based on the insights gained. Continuously test and optimize your campaigns to drive better results.
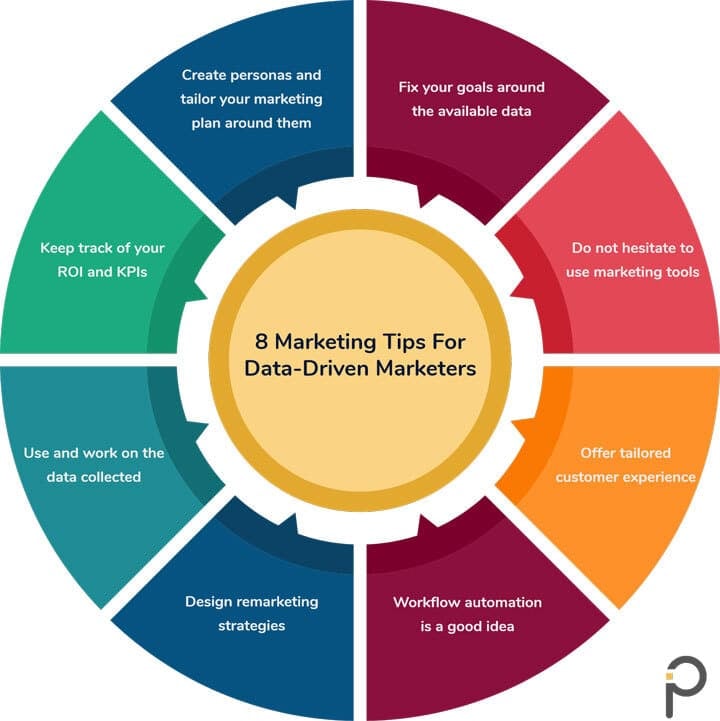
By leveraging the power of data, you can drive smarter decisions, optimize your strategies, and achieve remarkable growth. As you implement your B2B marketing analytics strategy, consider the following best practices to maximize the impact:
- Set clear objectives: Define what you want to achieve with your analytics. Whether it's increasing lead generation, improving conversion rates, or enhancing customer retention, having clear goals will guide your efforts.
- Choose the right tools: Invest in reliable analytics tools that align with your needs. Popular choices include Google Analytics, HubSpot, and Tableau. These tools can provide in-depth insights and are user-friendly.
- Clean and organize your data: Ensure your data is accurate and well-organized. Clean data sets lead to more reliable insights. Regularly update and audit your data to maintain its quality.
- Segment your audience: Break your audience into segments based on behavior, demographics, or firmographics. This allows for more targeted and personalized marketing strategies.
- Track key metrics: Focus on the metrics that matter most to your business. Common KPIs for B2B companies include lead quality, conversion rates, customer acquisition cost (CAC), and customer lifetime value (CLV).
- Use predictive analytics: Leverage predictive analytics to forecast future trends, identify high-potential leads, and optimize your marketing campaigns. This can help you make proactive decisions and stay ahead of the competition.
- Integrate with CRM: Ensure your analytics tools are integrated with your Customer Relationship Management (CRM) system. This provides a holistic view of your customer journey and improves the accuracy of your insights.
- Implement a robust attribution model: This will help you understand the contribution of each marketing touchpoint in the customer journey, enabling you to allocate resources more effectively.
- Run A/B tests: Regularly conduct A/B tests to compare the performance of different marketing assets, content, and strategies, and make data-driven decisions to improve your marketing effectiveness.
- Regularly review and adjust: Analytics is not a one-time task. Review your data, analyze the results, and adapt your strategies accordingly. This iterative process helps in continuous improvement.
Challenges and Solutions in B2B Marketing Analytics
Navigating the challenges of B2B marketing analytics can be tricky, but you can turn obstacles into opportunities with the right strategies. Here are some practical tips to help you overcome common challenges:
- Data quality: Ensure your data is clean and accurate. Regularly audit your data sources and use data cleansing tools to eliminate errors and inconsistencies.
- Integration issues: Seamlessly integrate your analytics tools with your CRM and other marketing platforms. Integrating B2B marketing analytics dashboards with CRM systems streamlines the process of tracking leads and conversions, offering a unified view of the customer journey.
- Complex metrics: Focus on the most relevant KPIs. Prioritize metrics like lead quality, conversion rates, and customer lifetime value to avoid getting overwhelmed by too much data.
- Skill gaps: Invest in training and development for your team. Equip them with the necessary skills to analyze and interpret data effectively. Provide training and support to facilitate adoption and communicate the benefits of B2BMA to all stakeholders.
- Keeping up with changes: Stay updated with the latest trends and advancements in analytics technology. Join industry forums, attend webinars, and read up-to-date blogs to keep your knowledge fresh.
Future Trends in B2B Marketing Analytics
As the B2B marketing techniques continue to evolve, we can expect to see several emerging trends and technologies shaping the future of B2B marketing analytics:
1. Increased adoption of AI and machine learning
Integrating AI-powered insights and predictive modeling will become more prevalent, enabling B2B organizations to make more informed, data-driven decisions.
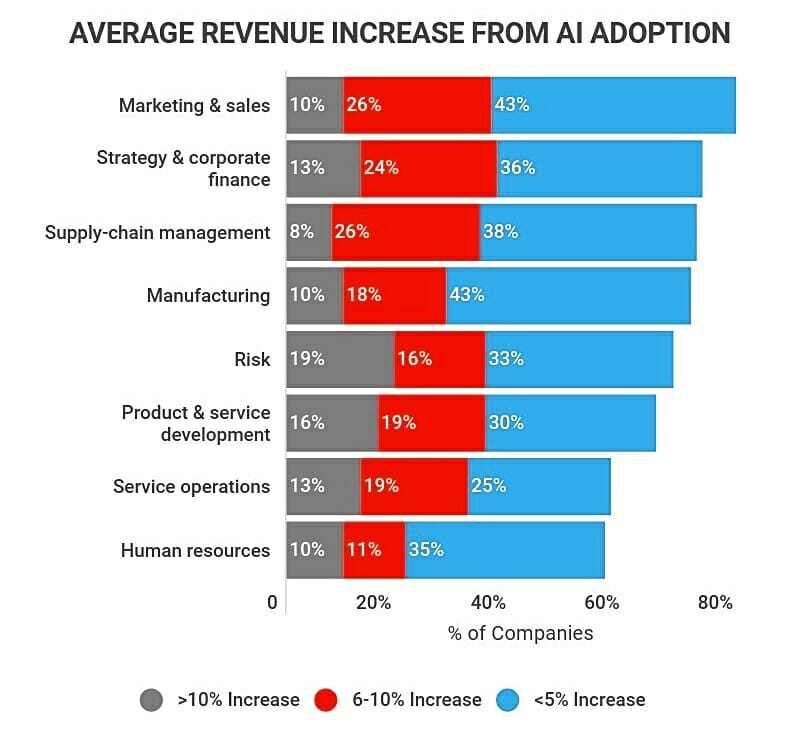
Advanced analytics, such as predictive modeling and machine learning, enable B2B marketers to forecast future trends, identify opportunities, and optimize their marketing strategies more effectively.
2. Focus on privacy and data security
With stricter data regulations and growing consumer concerns about privacy, B2B marketers will need to prioritize data governance and implement robust data management practices to ensure compliance and build trust with their customers.
3. Expansion of omnichannel analytics
As B2B buyers engage with brands across multiple touchpoints, comprehensive omnichannel analytics will become more crucial to providing a seamless and personalized customer experience.
4. Emergence of advanced visualization and reporting
Innovative data visualization tools and dashboards will continue to evolve, empowering B2B marketers to translate complex data into actionable insights more effectively.
5. Increased focus on personalization and account-based marketing
B2B buyers expect personalized experiences, and organizations leverage data and analytics to tailor their marketing efforts to individual customers and target accounts.
From Data to Success
The future of B2B marketing lies in the power of B2B marketing data analytics, which provides a competitive edge by uncovering hidden insights. It’s a game-changer for organizations looking to drive growth, enhance customer experiences, and make the most of their marketing investments.
Remember that achieving data-driven marketing excellence is an ongoing journey. Continuous learning, adapting, and staying committed to innovation are essential for navigating the evolving B2B marketing landscape and staying ahead of the competition.